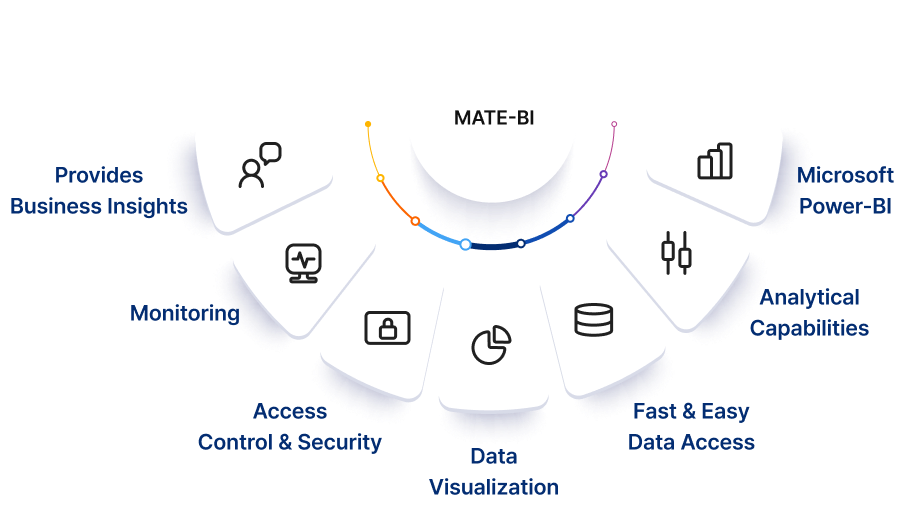
MATE-BI MATE Business Intelligence
Product Overview
MATE-BI (Business Intelligence) is a technology designed to collect and analyze data generated internally and externally to enhance corporate competitiveness in rapidly evolving markets.
MATE-BI Empowers business users to directly analyze the business environment using Microsoft Excel, a familiar analytical tool, and provides dashboard analysis reports for executives to understand the overall status and flow of operations.
Key Features
-
Provides Business Insights
Provides a function for critical decision-making information into a single view.
-
Monitoring
Provides monitoring of critical business metrics.
-
Access Control & Security
Controls screen access based on user permissions.
-
Data Visualization
Supports data visualization in various ways.
-
Fast & Easy Data Access
Enables easy and quick access to multiple data sources.
-
Analytical capabilities
Delivers analytical capabilities through integration with ERP and MES solutions.
-
Microsoft
Power BIOperates on the Microsoft Power BI engine.
Core Functions
-
Intuitive interfaces enables effortless usage for all users.
-
Enables in-depth analysis of data using advanced statistical techniques.
Insight
-
Automatic analysis feature provides immediate business insights.
-
Presents complex data intuitively through various charts and graphs.
-
Facilitates agile decision-making through real-time data monitoring.
(AI Voice Service)
-
Provides fast and easy data access via AI-driven voice commands.
-
Supports seamless scalability by integrating with various data sources.
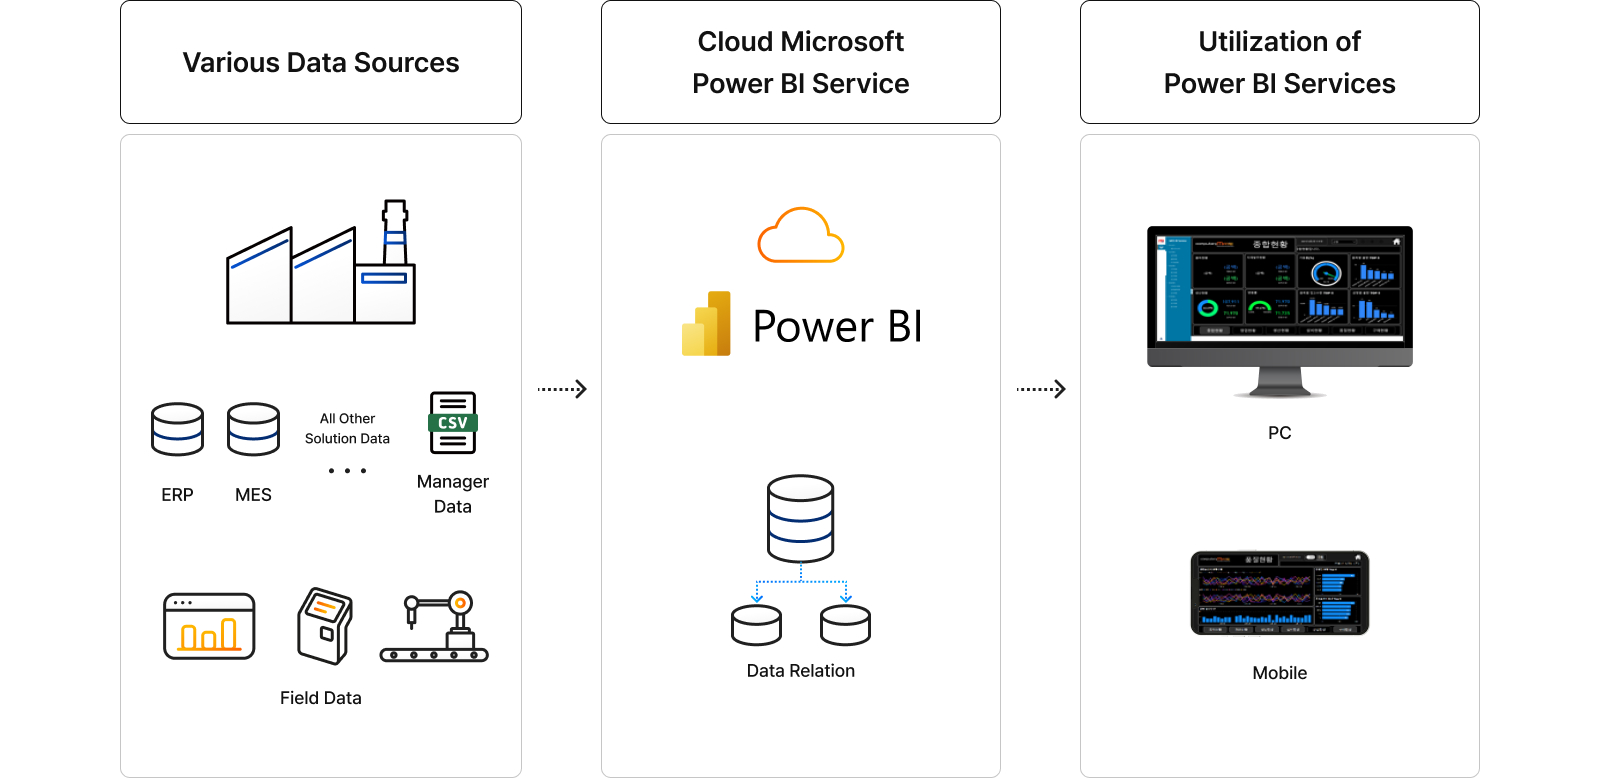
Work Process
-
Leveraging diverse
types of data sourcesExcel and Text Files
Database Data
Unstructured Data
using Hadoop -
Data Modeling
and OperationsDefining Data Relationships
Creating Fields
-
User-defined design and
format for report generationCharts and Images
Analysis Conditions
Types of Report Lists
-
Changing Report
Format and DataCharts and Images
Analysis Conditions
Types of Report Lists
-
Posting and
Sharing ReportsManagement of Read,
Report and Data
Modification Permissions
Expected Benefits
-
Optimization of Productivity and Inventory Management
Reduces costs by leveraging real-time data analysis and dashboards to optimize productivity and inventory status.

-
Enhanced Data-Driven Insights
Provides in-depth business insights through various data visualizations and statistical analyses.

-
Increased Supply Chain Efficiency
Enhances real-time monitoring of overall supply chain flows through integration with diverse data sources, enabling rapid issue resolution.

-
Integrated Information for Field Practitioners and Management
Provides customized reports necessary for both field personnel and executives by integrating operational and managerial data.

Screen Examples
-
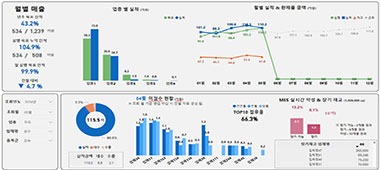
Monthly Sales Performance -
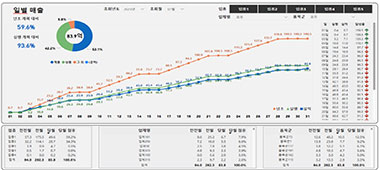
Daily Sales Figures -
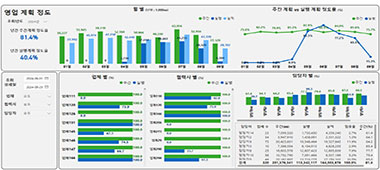
Sales Plan Accuracy -
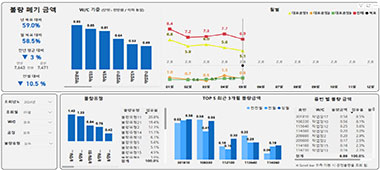
Defective Disposal Costs -
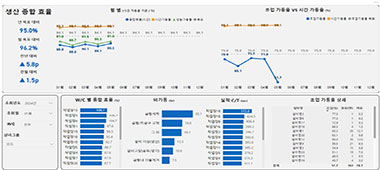
Overall Production Efficiency -
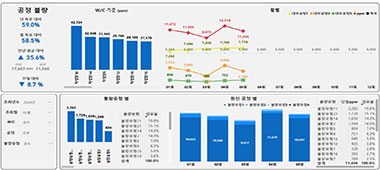
Process Defect Status